研究プロセス
69 査読済み研究からの図表
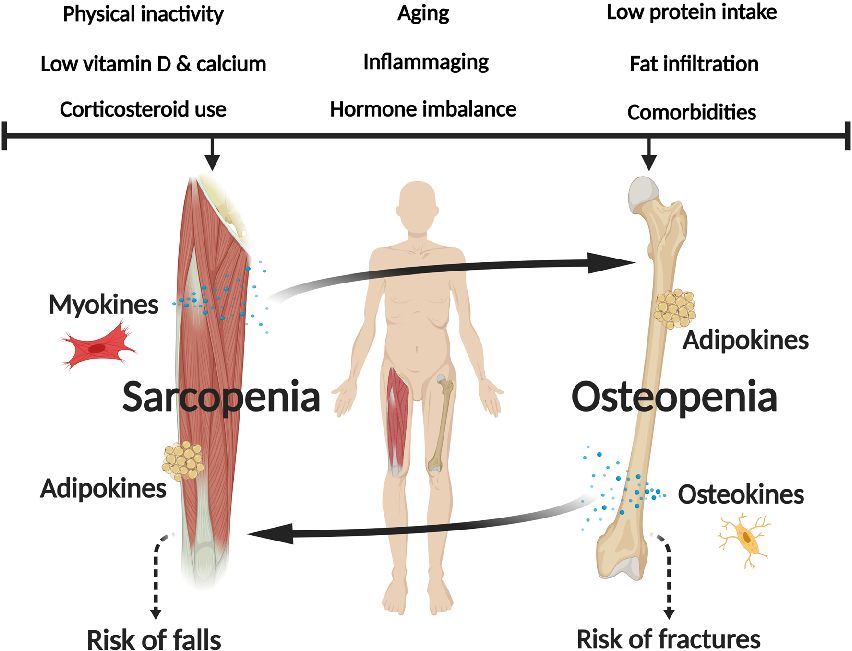
Pathophysiological mechanisms shared between osteoporosis and sarcopenia are diagrammed, including hormonal, nutritional, and mechanical loading factors.
Osteosarcopenia: epidemiology, diagnosis, and treatment-facts and numbers.
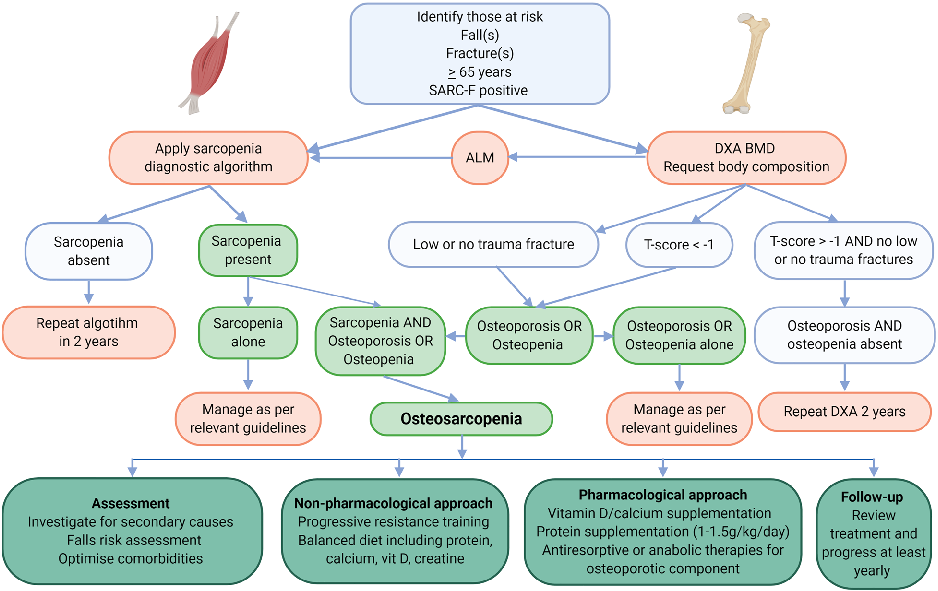
Treatment algorithms for osteosarcopenia incorporating exercise, nutritional supplementation, and pharmacological interventions are outlined.
Osteosarcopenia: epidemiology, diagnosis, and treatment-facts and numbers.
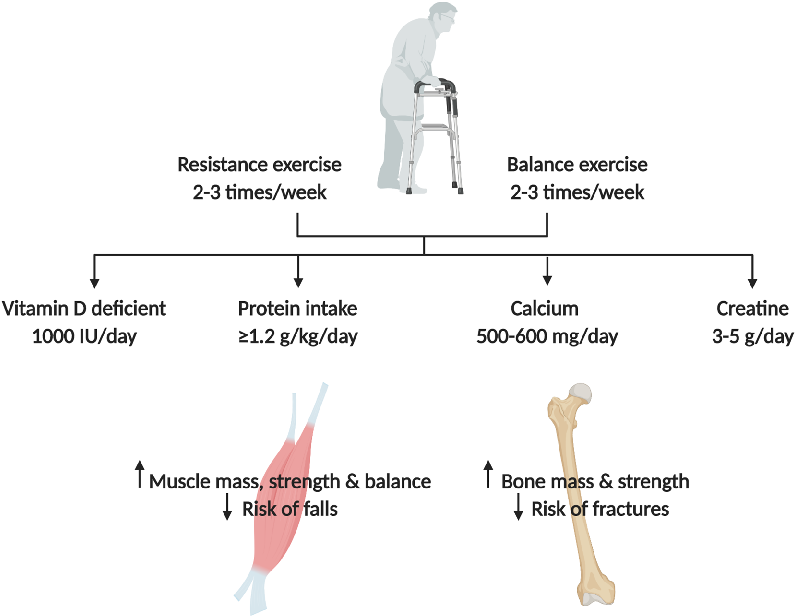
Outcome data from intervention studies targeting both bone and muscle health in osteosarcopenic patients are compared across different therapeutic approaches.
Osteosarcopenia: epidemiology, diagnosis, and treatment-facts and numbers.
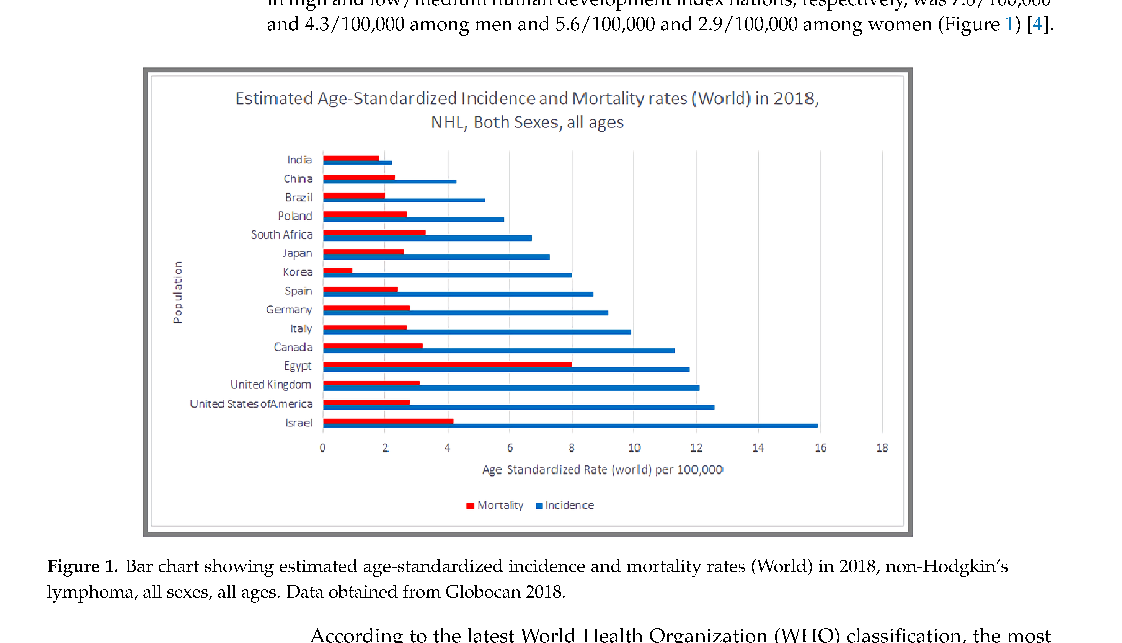
NHL mortality patterns reflect disparities in treatment access and disease subtype distribution. This figure presents survival and mortality data across different NHL classifications.
Epidemiology of Non-Hodgkin's Lymphoma.
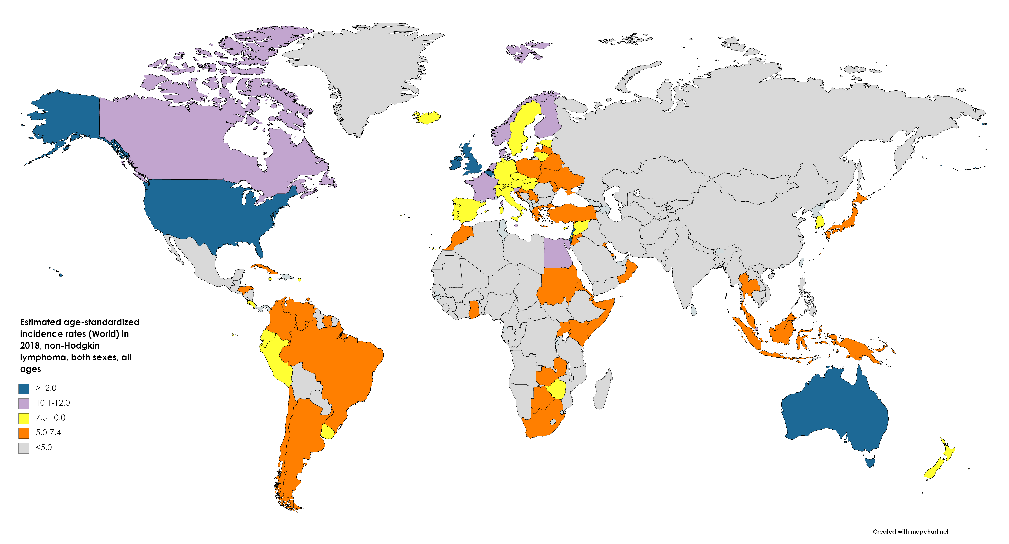
The epidemiological profile of Non-Hodgkin's lymphoma continues to evolve with improved molecular classification. This figure provides additional epidemiological data on NHL subtypes and their relative frequencies.
Epidemiology of Non-Hodgkin's Lymphoma.
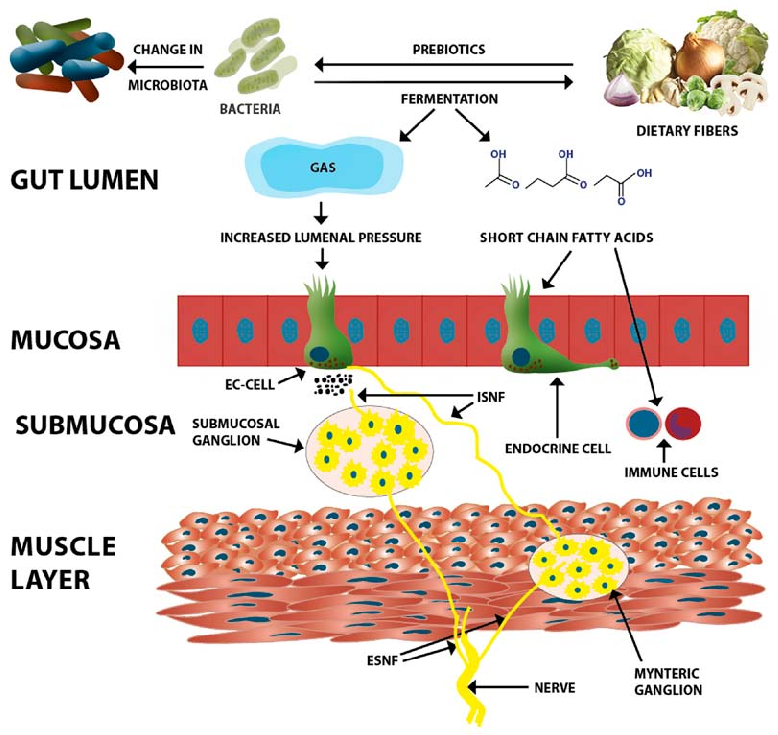
Dietary fiber acts as a prebiotic for intestinal microbiota, promoting growth of beneficial bacteria and production of short-chain fatty acids. This diagram illustrates multiple mechanisms through which fiber affects gastrointestinal function, including modulation of gut microbiome composition and intestinal barrier integrity.
Dietary fiber in irritable bowel syndrome (Review).
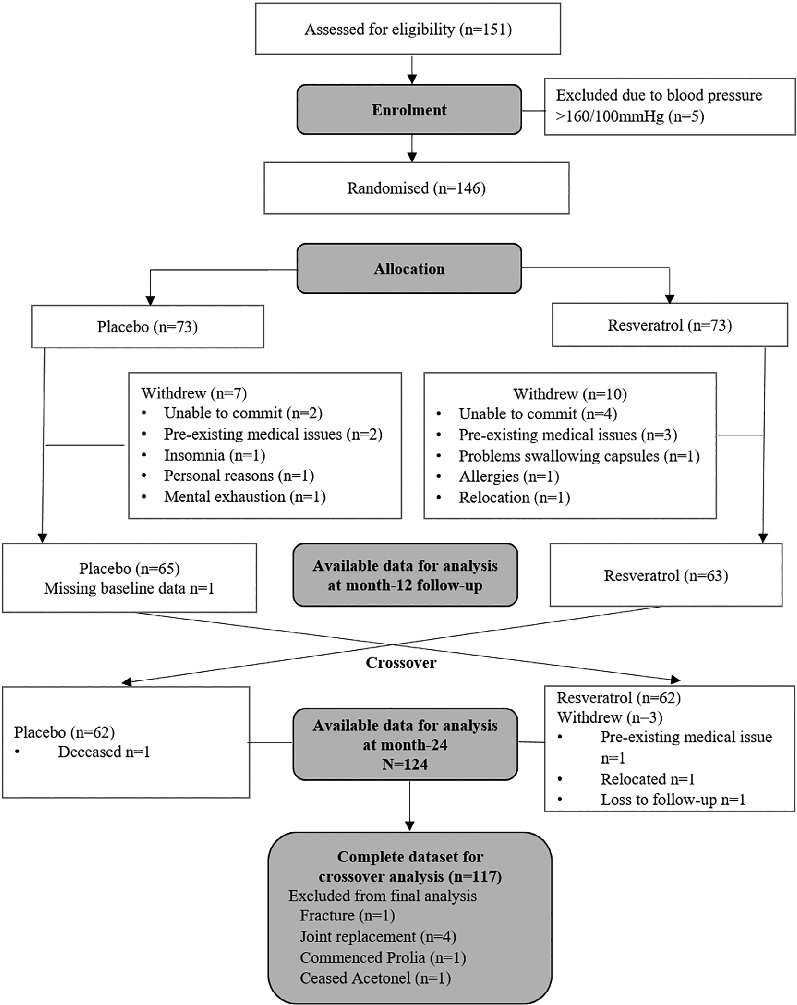
Participant flow or baseline characteristics from a randomized placebo-controlled trial of resveratrol supplementation in postmenopausal women are presented. The study tested whether regular resveratrol intake could improve bone mineral density in women at risk for osteoporosis.
Regular Supplementation With Resveratrol Improves Bone Mineral Density in Postmenopausal Women: A …
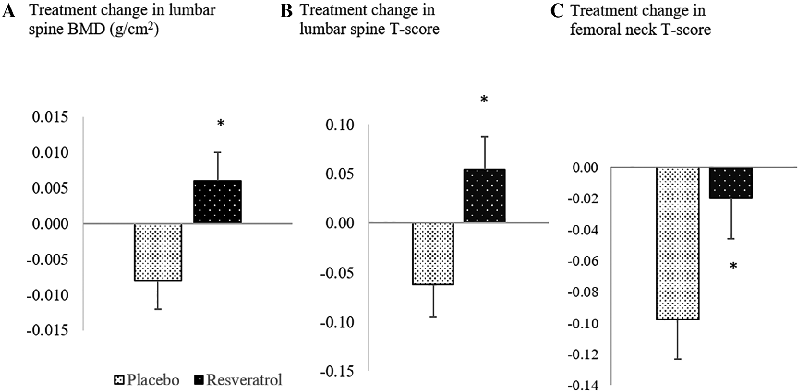
Bone mineral density measurements at key skeletal sites are compared between resveratrol and placebo groups over the trial period. Resveratrol, a polyphenol found in red grapes, was hypothesized to act as a phytoestrogen with bone-protective properties.
Regular Supplementation With Resveratrol Improves Bone Mineral Density in Postmenopausal Women: A …
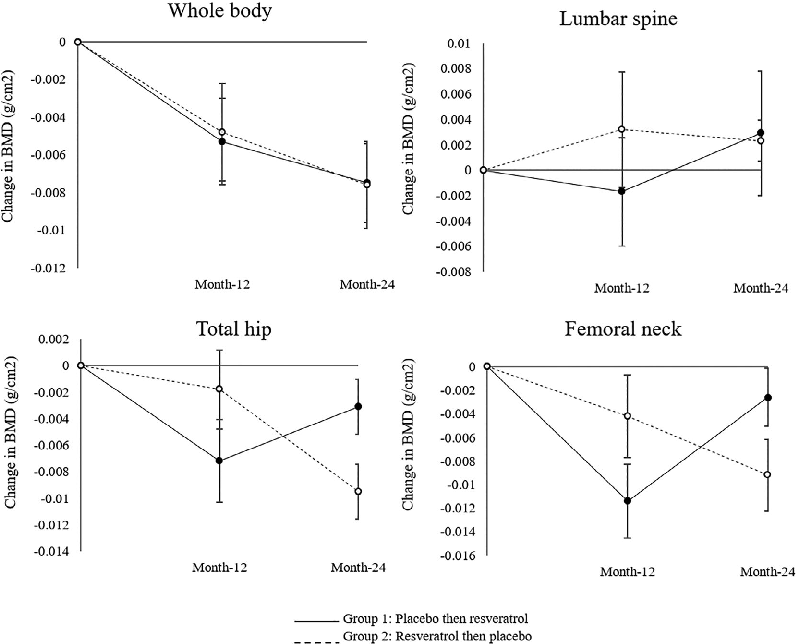
Secondary outcomes or biomarker data from the resveratrol supplementation trial are displayed. The analysis examines whether improvements in bone mineral density correlate with changes in bone turnover markers or inflammatory mediators.
Regular Supplementation With Resveratrol Improves Bone Mineral Density in Postmenopausal Women: A …
Neurological consequences of chronic manganese exposure are summarized, including cognitive impairment, motor dysfunction, and emotional disturbances. The symptoms collectively termed manganism share clinical features with Parkinson's disease.
Consequences of Disturbing Manganese Homeostasis.
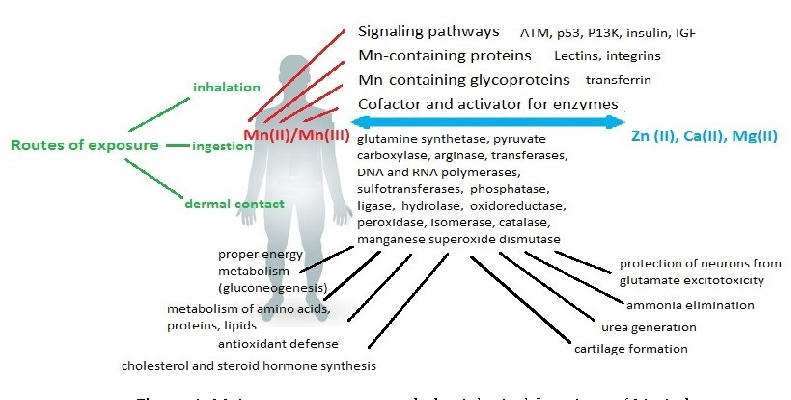
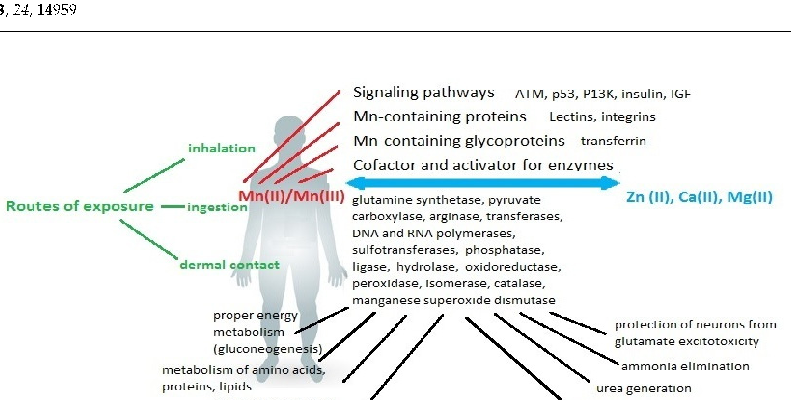
Manganese's dual role as both essential nutrient and potential toxin is explored through its effects on enzymatic systems. Superoxide dismutase, arginase, and glutamine synthetase all require manganese as a cofactor for normal function.
Consequences of Disturbing Manganese Homeostasis.
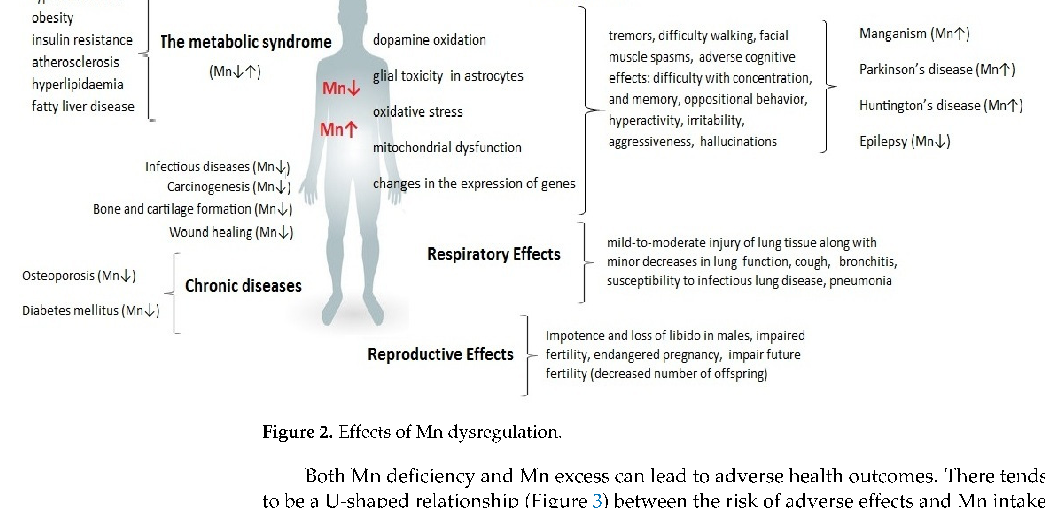
A comprehensive diagram maps the systemic effects of manganese dysregulation across multiple organ systems. Both deficiency and excess disrupt metabolic processes, with the nervous system being particularly vulnerable to manganese imbalance.
Consequences of Disturbing Manganese Homeostasis.
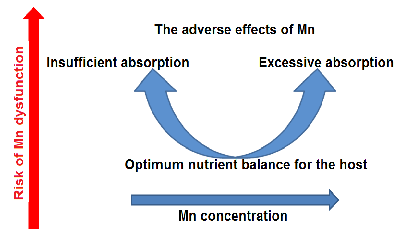
The U-shaped dose-response curve for manganese illustrates that both deficiency and excess are associated with adverse health outcomes. An optimal range exists where manganese fulfills its essential cofactor roles without triggering neurotoxic or systemic damage.
Consequences of Disturbing Manganese Homeostasis.
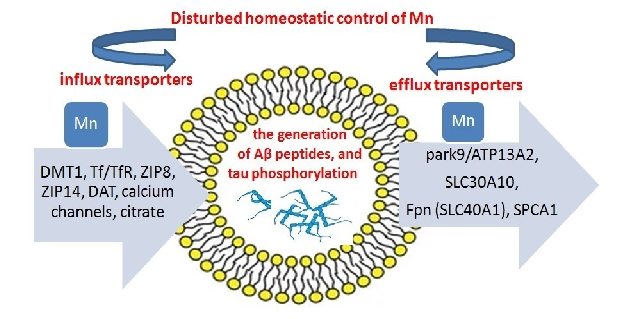
A model of manganese transport imbalance depicts the interplay between uptake, distribution, and excretion mechanisms. Disruption of transporters such as SLC30A10 and SLC39A14 can lead to pathological manganese accumulation in target tissues.
Consequences of Disturbing Manganese Homeostasis.
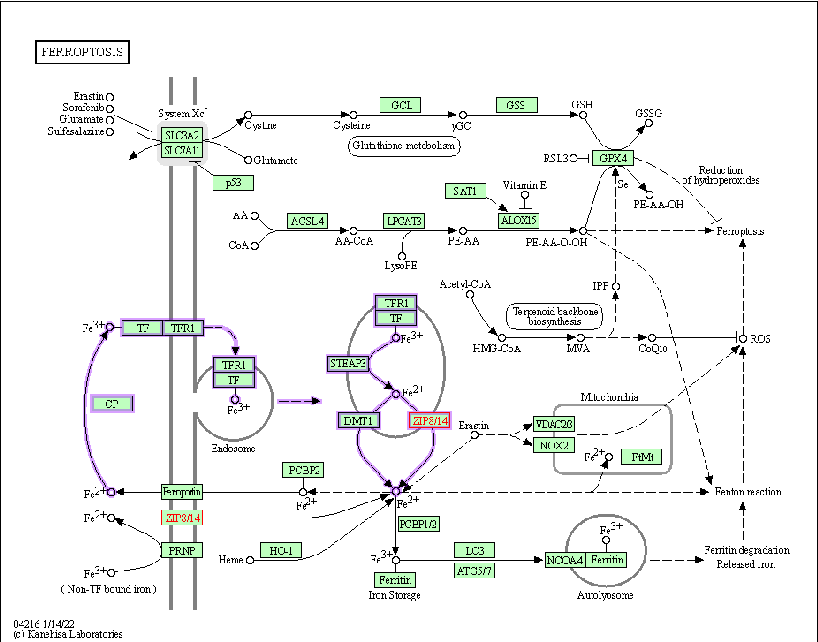
Supplementary or concluding data on manganese homeostasis consequences are presented. The review emphasizes that maintaining manganese within a narrow physiological range is critical for preventing both deficiency-related enzyme dysfunction and toxicity-related neurodegeneration.
Consequences of Disturbing Manganese Homeostasis.
Body composition changes observed in participants following vegan dietary interventions are tracked over time, showing reductions in visceral adiposity and overall fat mass.
Vegan Diet Health Benefits in Metabolic Syndrome.
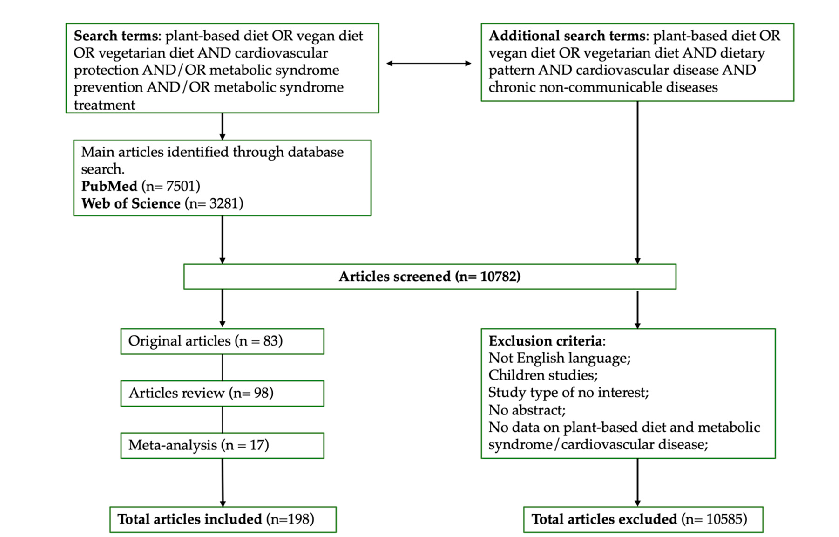
The complete literature search strategy for this systematic review of vegan diet effects on metabolic syndrome is presented, detailing database queries and Boolean operators used to identify eligible studies.
Vegan Diet Health Benefits in Metabolic Syndrome.
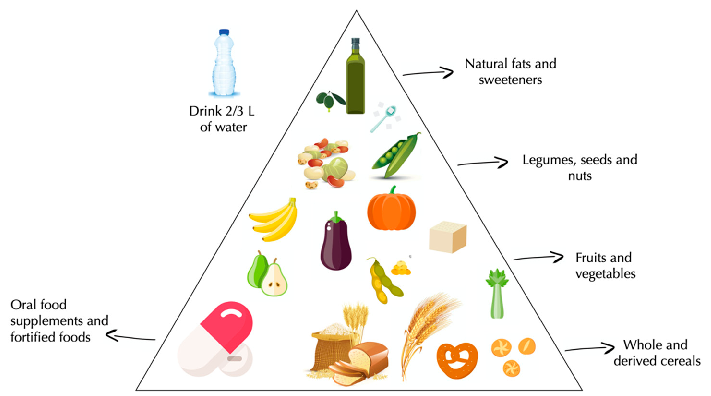
A vegan food pyramid illustrates recommended dietary proportions for plant-based nutrition, organizing food groups by suggested intake frequency to support metabolic health.
Vegan Diet Health Benefits in Metabolic Syndrome.
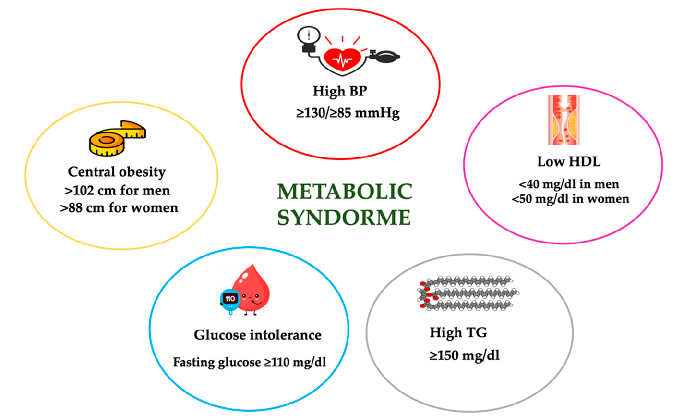
PRISMA flow diagram for study selection in this review of vegan diet and metabolic syndrome is depicted, showing records identified, screened, and ultimately included.
Vegan Diet Health Benefits in Metabolic Syndrome.
Insulin sensitivity indices before and after vegan dietary intervention are plotted, demonstrating improved glucose homeostasis in the plant-based diet group.
Vegan Diet Health Benefits in Metabolic Syndrome.
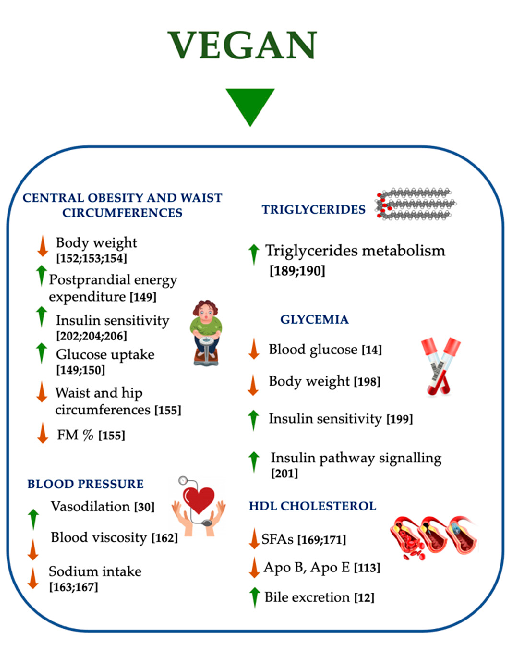
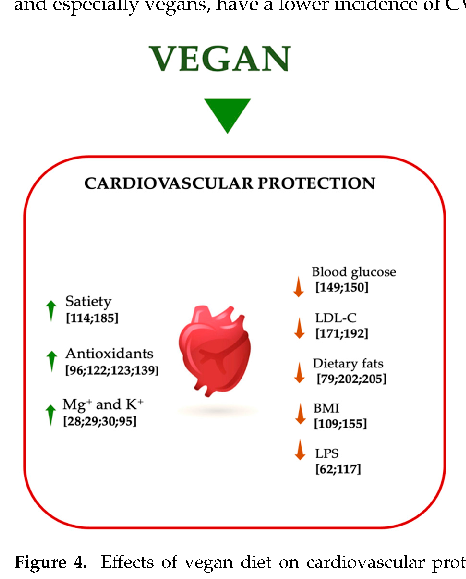
Beneficial effects of a vegan diet on metabolic syndrome components are mapped, showing improvements in apolipoprotein profiles, fat mass reduction, and decreased saturated fatty acid intake alongside their downstream metabolic consequences.
Vegan Diet Health Benefits in Metabolic Syndrome.
![Figure 1. The iRISA syndrome [76] in addiction is centrally controlled by dopamine in the brain, while asynchronization, presumed to be linked to cue sensitivity in digital addiction [50–54], is centrally controlled by serotonin. A deficit in both neurotra](https://pdfs.citedhealth.com/figures/35682491/101.png)
The impaired Response Inhibition and Salience Attribution (iRISA) syndrome model is illustrated, showing how dopamine-mediated reward pathways in the brain drive cue sensitivity in digital addiction and contribute to sleep disruption.
Digital Addiction and Sleep.
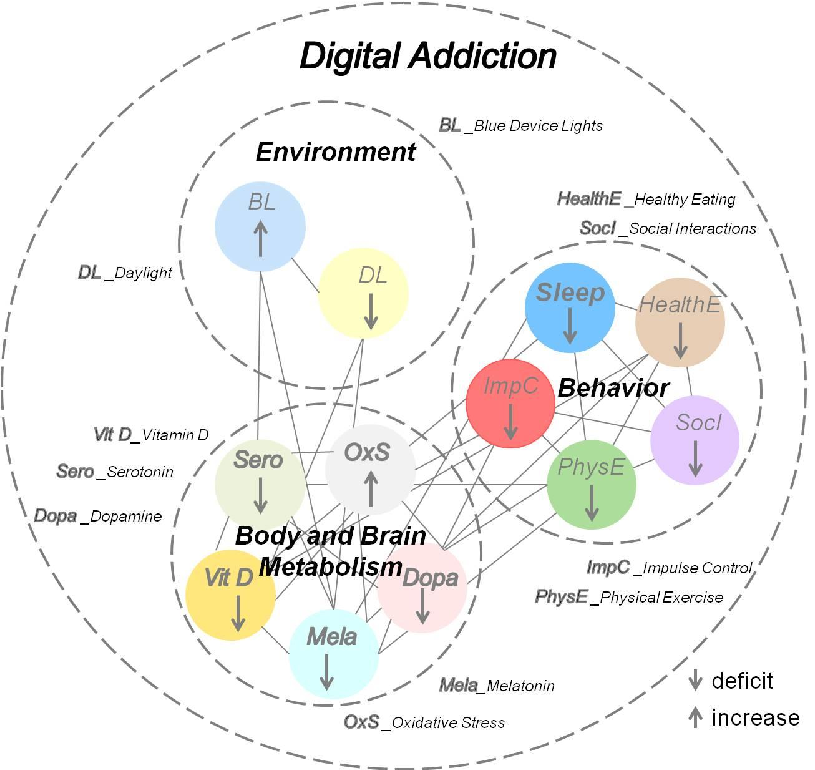
Neurobiological mechanisms linking excessive digital device use to disrupted sleep architecture are outlined, connecting screen-mediated blue light exposure and dopaminergic reward activation to circadian rhythm disturbances.
Digital Addiction and Sleep.
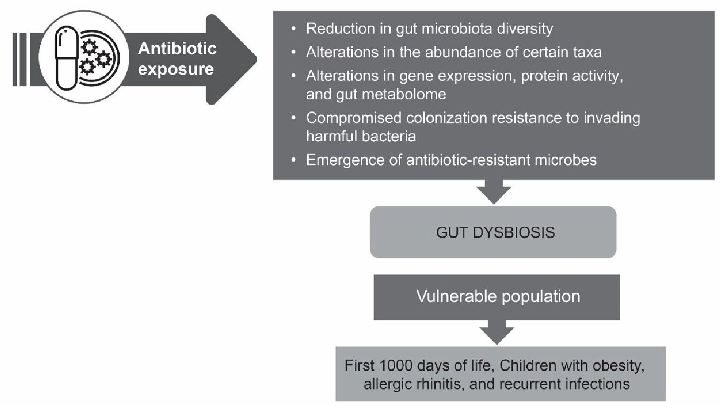
Approaches for managing antibiotic-associated dysbiosis are summarized, including strategies to restore gut microbial diversity after antibiotic treatment. The figure outlines interventions such as probiotics and microbiota-targeted therapies that may help mitigate dysbiosis in populations predisposed to gut disruption.
Current understanding of antibiotic-associated dysbiosis and approaches for its management.
3ページ中1ページ目